Recently, I was setting up the Power Platform Center Of Excellence Starter Kit. Per the instructions, I imported the template, connected the Dataverse data, and published the report. Everything was working except the Bing Maps and Visuals.
This blog will review the settings to enable Bing Maps and Visuals.
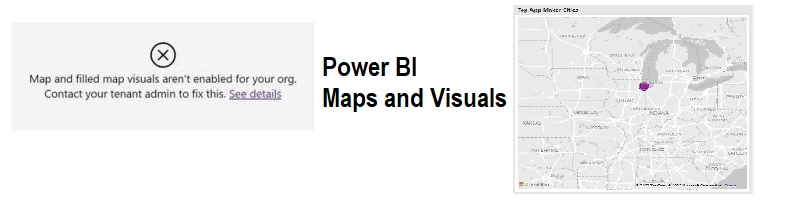
Report Visualization (Map Error)

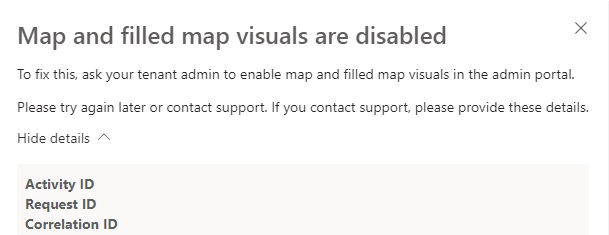
Error Details
Solution
We must turn on the Maps at the organizational level and the report in Power BI.
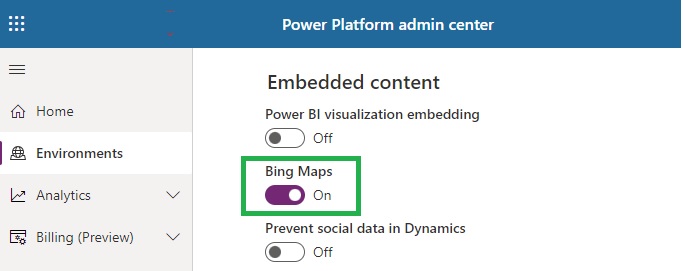
1. Power Platform Environment Setup
- Browse to the Microsoft Power Platform admin center
- Sign in using administrator credentials.
- Go to Environments
- Select an environment]
- Settings > Product > Features.
- Under Embedded Content, turn on Bing Maps.
2. Turn on Power BI
- Go to file
- Option and settings
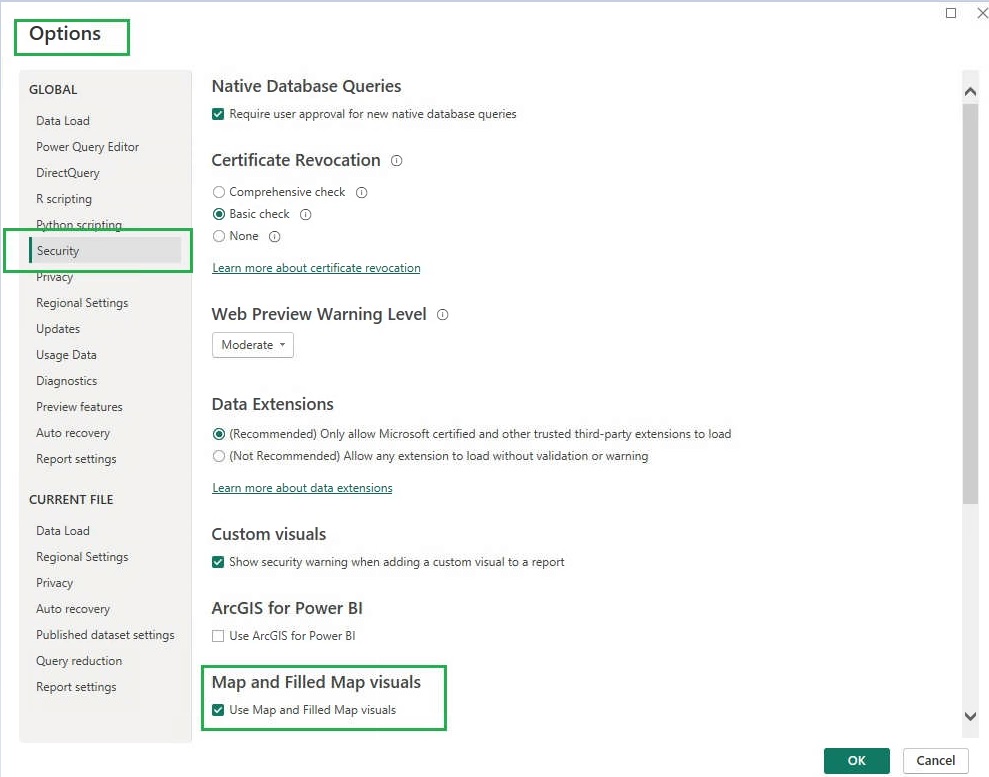
- Options
- Global(Security)
- Enable Map and filled map visuals.
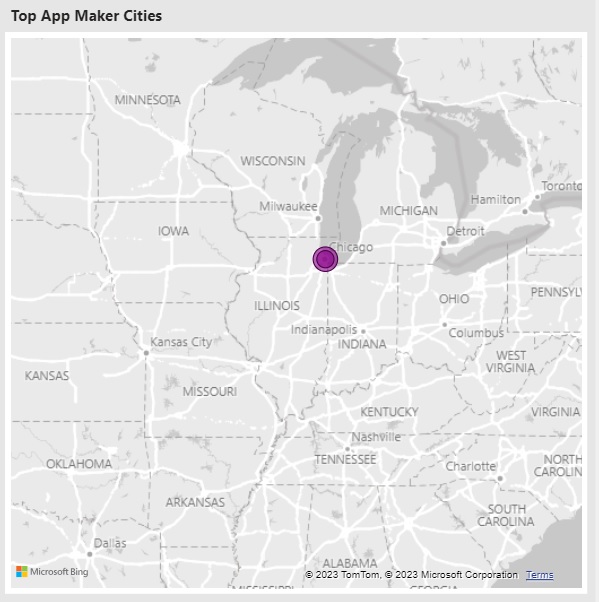
Final Display
Maps and Visuals are displayed after being enabled on Organization and report levels.