

In my last post, “LOG TELEMETRY FOR CANVAS APP USING APPLICATION INSIGHTS” we discussed how to log or view canvas application telemetry in Azure Application Insights. Now, we are going to discuss how to view logs in PowerApps Monitor and Application Insights.
PowerApps log can be viewed in built into PowerApps Monitor or Azure Application Insights (App Insights).
PowerApps Monitor
Using built in PowerApps monitor, we can trace events , custom logs and any user action. This tool can be used for development and even published app. To do that
- Go to PowerApps
- Open any app
- Click “Advanced Tools” on the left navigation menu

- This opens a new browser and monitoring starts automatically. This includes User Action, Function, network and many more.
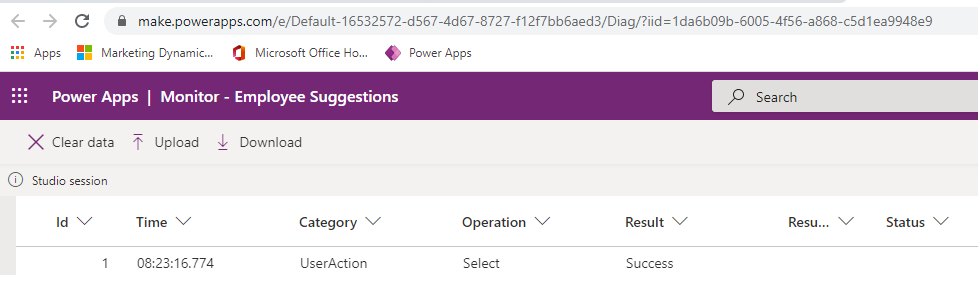
- Click on the any row to see more details
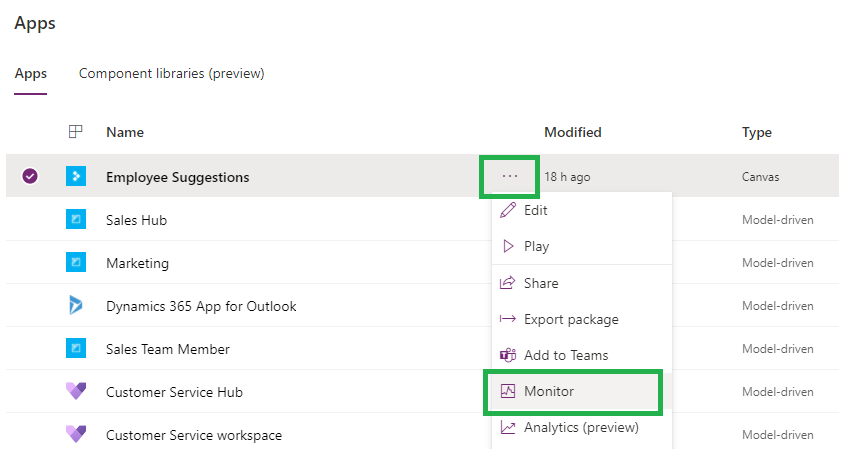
- For published app,
- On the left pane, select Apps
- Select an app from the list
- Select Monitor from the menu. Or, you can select More Commands (…), and then select Monitor
- Here is the Microsoft Article for debugging
In different application, we do logging differently. In Canvas app we are using function called Trace.
Trace Function in Canvas App
Trace is an optional expression that can be used to provide additional information (Custom logging) along with built in event tracing
Syntax
Message – Required. The information (Custom Logging) to be traced
Trace_severity – Optional. The severity level of the Trace recorded in Application Insights. Options are Information, Warning or Error.
Custom_record – Optional. A record containing custom data that will be recorded in Application Insights
Custom record – JSON format that contains any custom data or logging information
Example
- Trace(“Contacts Gallary Loaded”,TraceSeverity.Information)
- Trace(“Contacts Gallary Loaded”,TraceSeverity.Information, {Screen: App.ActiveScreen.Name, Control: “OnStart”})
- Trace(“Contacts Gallary Loaded”,TraceSeverity.Error, {Screen: App.ActiveScreen.Name, Control: “Save Data”})
View the logs in Application Insights
When the app insights are connected to a PowerApps Canvas Screen it allows to capture telemetry such as Screen Views, Duration, Custom Events and Errors. If implemented correctly, this telemetry is useful to understand how users are using the app.
Publish the app and do some actions, so that system can collect some information. Now, new events generated in App Insights. These events will be displayed in the session details, or you can directly query them from the Logs.
From Azure Application Insights, we can create an alert to automatically notify the user or admin if errors get logged, or if there was a sudden increase in errors experienced in the app.
- Go to https://portal.azure.com
- Open the App insights that we created and linked to the canvas app
- Click “Logs” on the left navigation

- Log queries are very powerful and we can use them to join multiple tables, aggregate large amounts of data and perform complex operations
- Here is my query to get trace logs
- Sample query
- traces
| where message contains “started” or message contains “loaded” or message contains “Updated”
| limit 50
| order by timestamp desc - Run the query and we can even save the query for later use

- We can built Power BI report for deep analysis
I hope this helps you. Happy Development!