
This blog will discuss how to use GroupBy in PowerApps. Still, I’m getting some questions on the forum to sum or average by date.
Requirement
In PowerApps, businesses would like to display the data based on some grouping. For example, you have an expense sheet for business travel and display the sum by category.
Expense Report – Raw Data

ClearCollect(PowerTravelExpenses,
{ExpenseDate: Date(2022,10,1), ExpenseItem: “Flight”, Amount: 255},
{ExpenseDate: Date(2022,10,1), ExpenseItem: “Hotel”, Amount: 160},
{ExpenseDate: Date(2022,10,1), ExpenseItem: “Food”, Amount: 15 },
{ExpenseDate: Date(2022,10,2), ExpenseItem: “Food”, Amount: 27 },
{ExpenseDate: Date(2022,10,3), ExpenseItem: “Hotel”,Amount: 180},
{ExpenseDate: Date(2022,10,3), ExpenseItem: “Food”, Amount: 9},
{ExpenseDate: Date(2022,10,4), ExpenseItem: “Food”, Amount: 20}
);
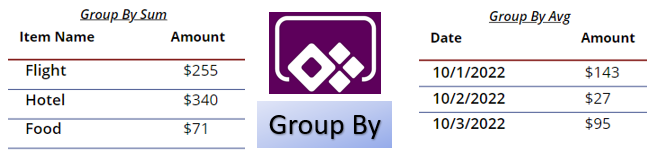
Expected Result
- Get Sum on each category
- Get an Average on each date
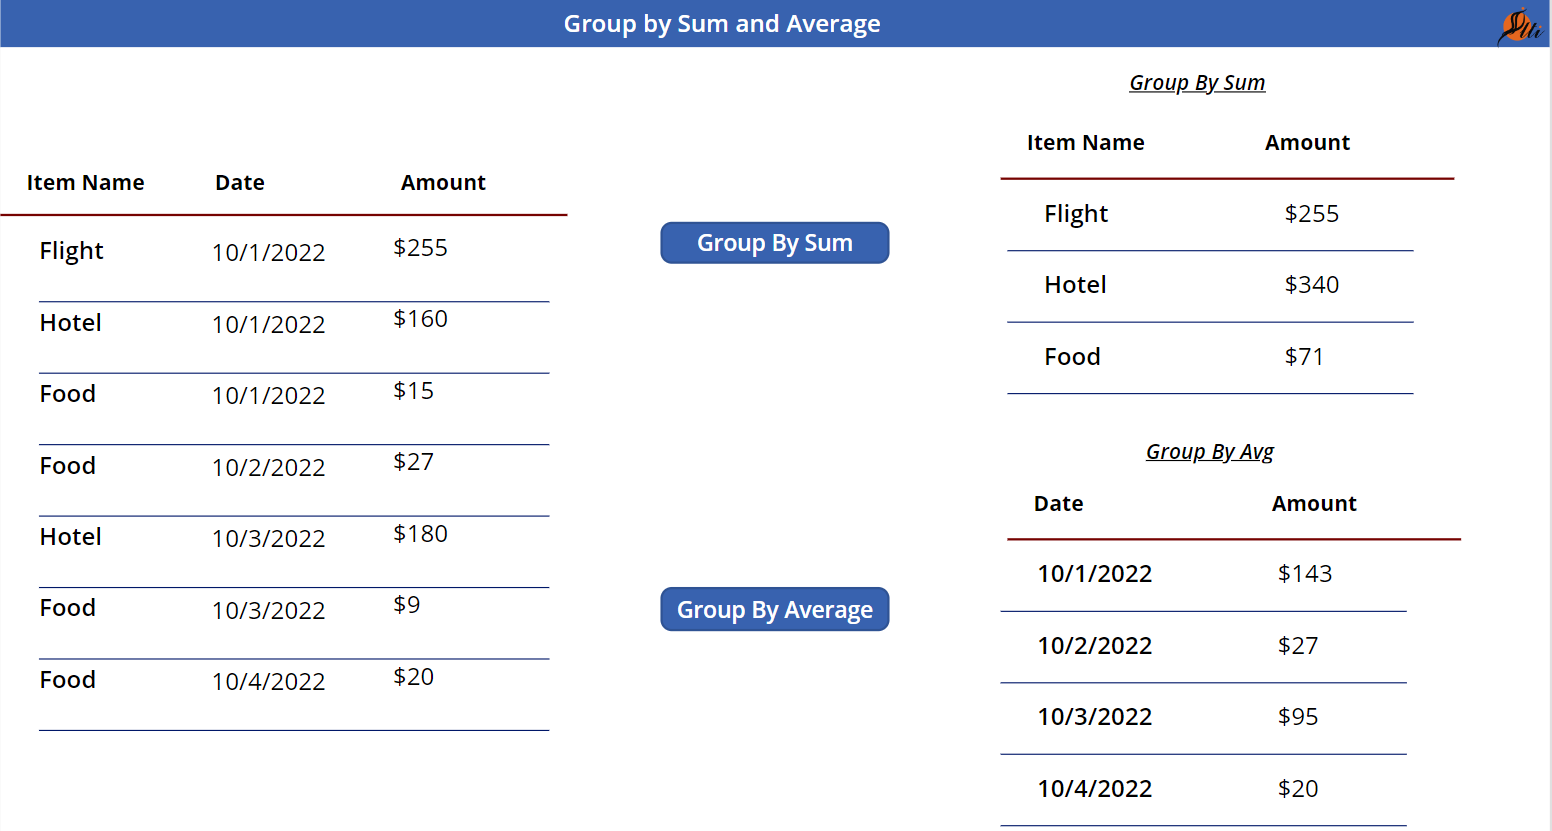
1. PowerFx Code – Get Sum on each category
ClearCollect(
SolutionGroupBySum,
DropColumns(
AddColumns(
GroupBy(PowerTravelExpenses,”ExpenseItem”,”GroupedItems”),
“Sum of Value”,Sum(GroupedItems,Amount)
),
“GroupedItems”
)
);
- PowerTravelExpenses – Collection which has Raw Data
- ExpenseItem – Name or Expense Category
- SolutionGroupBySum – Output stored in this collection
- Amount – How much cost or spent
- GroupedItems – Variable
2. PowerFx Code – Get Average on each Date
ClearCollect(
SolutionAvgBy,
DropColumns(
AddColumns(
GroupBy(PowerTravelExpenses,”ExpenseDate”,”GroupedItems”),
“Sum of Value”, Round(Average(GroupedItems,Amount),0)
),
“GroupedItems”
)
);
Conclusion
GroupBy is a compelling command in PowerApps which helps to group to get sum or average.